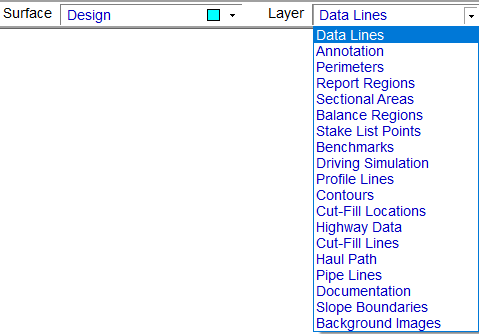
The Design Surface is composed of several layers. The example below shows the available Design Surface Layers. A brief explanation about the layers is found below.

Data Lines |
Data Lines contain all the lines, points and labels relevant to the design. Data contained within this layer is used to generate the 3D surface. |
Annotation |
2D information not used to form the 3D surface. 2D CAD Data is automatically moved to this layer during transfer. |
Perimeters |
Creates a limit for grading and defines the bounding edge of the design. When Staged Design is On, the perimeter determines where the Design Surface ties into the Existing Surface. The user is asked whether or not to include a drape line for any perimeter generated in Entry Mode. |
Report Regions |
Used to define the area of the job to be included in the volume calculation and on the volume report. |
Sectional Areas |
A modifying layer used to creates areas of structural sections. Sectional Areas modify the design to form the subgrade surface. |
Balance Regions |
Used to define the area of the job for balancing. Creates an additional line in the Annotation Lines layer showing the Haul Path. |
Stake Point List |
Contains points used for staking in Graphic Grade. |
Benchmarks |
Benchmarks are commonly used when exporting the job to Google Earth. The Benchmarks must contain Latitude and Longitude to export the KMZ file. |
Driving Simulation |
Allows entry of a path for the vehicle to follow during the driving simulation. |
Profile Lines |
Used to create profiles and cross sections across the job. This lines are also used to create stations and offsets. |
Contours |
Lines created when using the Contour Surface command from the Utility Menu in Edit Mode. |
Cut/Fill Labels |
These are spots entered to be used in conjunction with the User Cut Fill Values located under the View Menu in Planview Mode. |
Highway Data |
Data generated from Highway mode. |
Cut/Fill Lines |
Lines that define the boundary of the cut and fill areas on the job. These lines are placed according to the Edit Cut-Fill Transition value. |
Haul Path |
These lines are generated when calculating Balance Regions. The lines run from the center of mass of the cut to the center of mass of the fill. |
Pipe Lines |
These lines are entered to calculate the trench volumes. |
Documentation |
Contains user added Notes or 3D Notes entered in Sitework 4D or Notes and Photos imported from SmartPlan. |
Slope Boundaries |
Lines created when applying Slope Boundaries. The layer will only display after Slope Boundaries have been applied. |
Background Images |
Contains the sheet borders for imported PDF and TIF files. |